Built to Solve Real Problems.
Tools, systems, pipelines, and an app in development — most replacing manual workflows that shouldn't have existed in the first place.
AfterGas
ANDROID APP · IN DEVELOPMENT
Gig workers know what they earned. AfterGas shows what they kept — after real fuel costs, per mile, per platform, per hour. Built from a real driver's frustration with not knowing his actual profit margin. Features real MPG data from the US Dept. of Energy, IRS deduction tracking, a real-time "Worth It?" offer evaluator, platform comparison charts, and a PDF tax report. Currently in development — submitting to Google Play soon.
Identity Implementation Toolchain
Three connected tools covering the full K-12 identity platform implementation lifecycle — Python audit generator, browser-based district tracker with DVR delta tracking, and a Claude API configuration validator used live on client calls. Each tool feeds the next.
SOQL Query Workbench — NPSP Edition
A library of the queries a nonprofit data analyst actually runs — household giving roll-ups, soft credit recognition, LYBUNT/SYBUNT lapse reports, lapsed major donors — in real SOQL syntax against NPSP objects, executed live against an in-browser sample dataset.
Multi-Dimensional Quota & Sampling Engine
Interactive demonstration of multi-dimensional quota management in survey production — translating client-issued quota specifications into manageable sample structures, with a 32-cell age × region × sample-type matrix, shift-by-shift fill simulation, attainment heatmap, and a variance report that converts pacing math into floor decisions.
Lakeside Migration Case Study
End-to-end data operations audit for a fictional nonprofit moving from Raiser's Edge to Salesforce NPSP — source profiling, anomaly detection (5 types), field mapping with crosswalk, KNIME transformation pipeline, and clean staging file production. 214 source records → 163 clean records ready for Data Import Wizard.
NPSP Donor Data Operations Simulator
Interactive walkthrough of the four data operations at the core of Salesforce NPSP work — Household Account grouping with giving roll-ups, hard vs. soft gift credits, constituent deduplication with merge preview, and a preference-aware tax receipt batch run with full exclusion logging.
Operational Data Transformer
Python/Tkinter desktop GUI for transforming structured operational files via configurable conditional rules before system ingestion. Replaced entirely manual data preparation workflows.
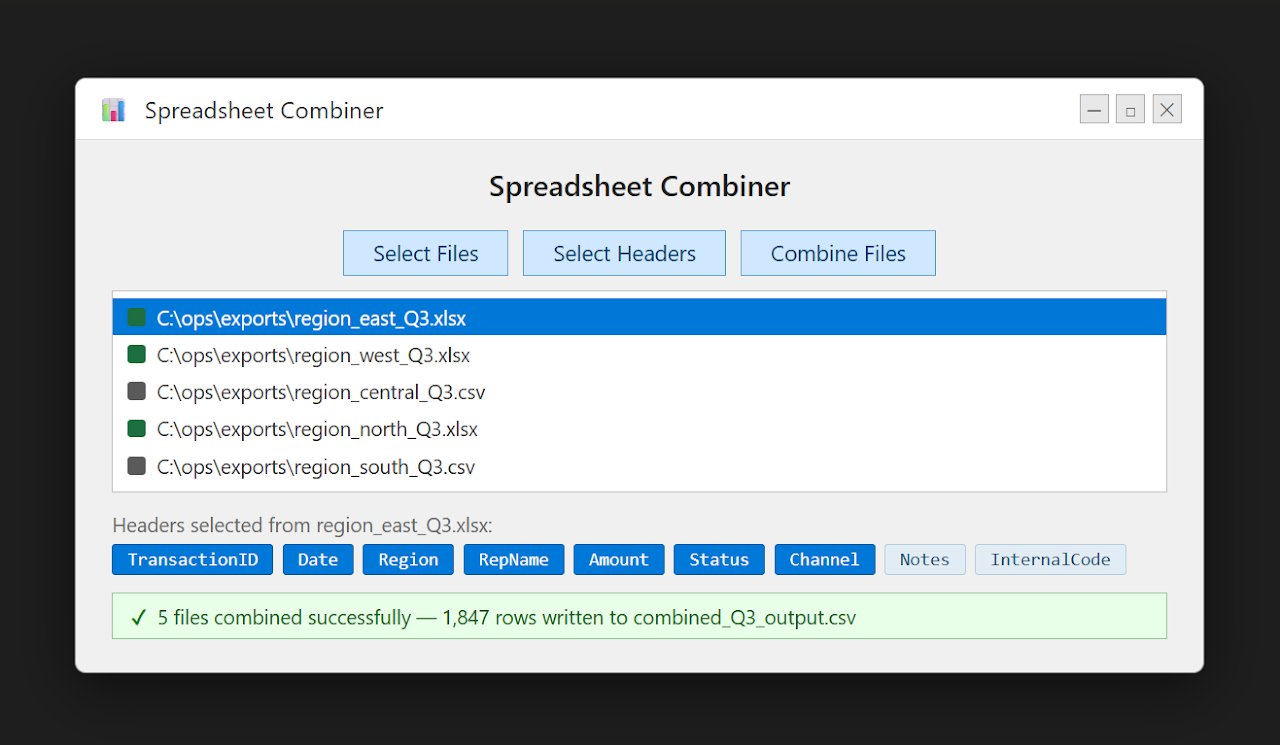
Multi-Source Dataset Combiner
Python GUI that merges datasets from multiple disparate sources into a unified structure for reporting and analysis — eliminating manual consolidation across operational data systems.
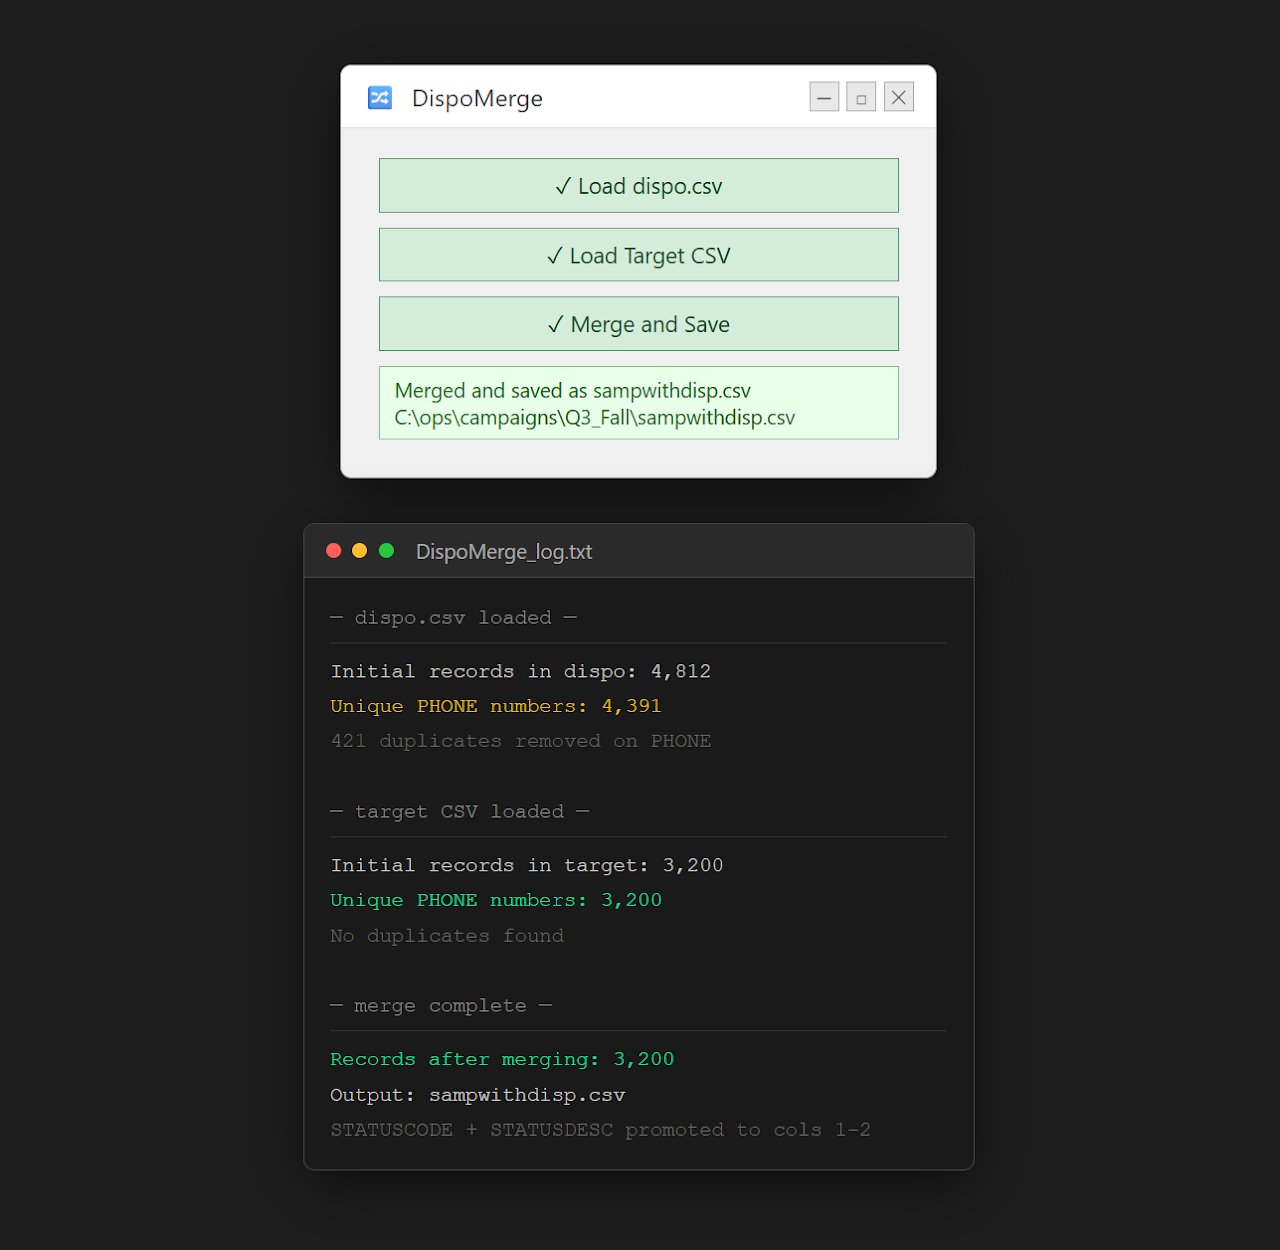
Disposition Merge Automation Tool
Merges and standardizes disposition-level data from multiple sources into a unified reporting dataset — replacing manual consolidation and significantly improving data consistency.
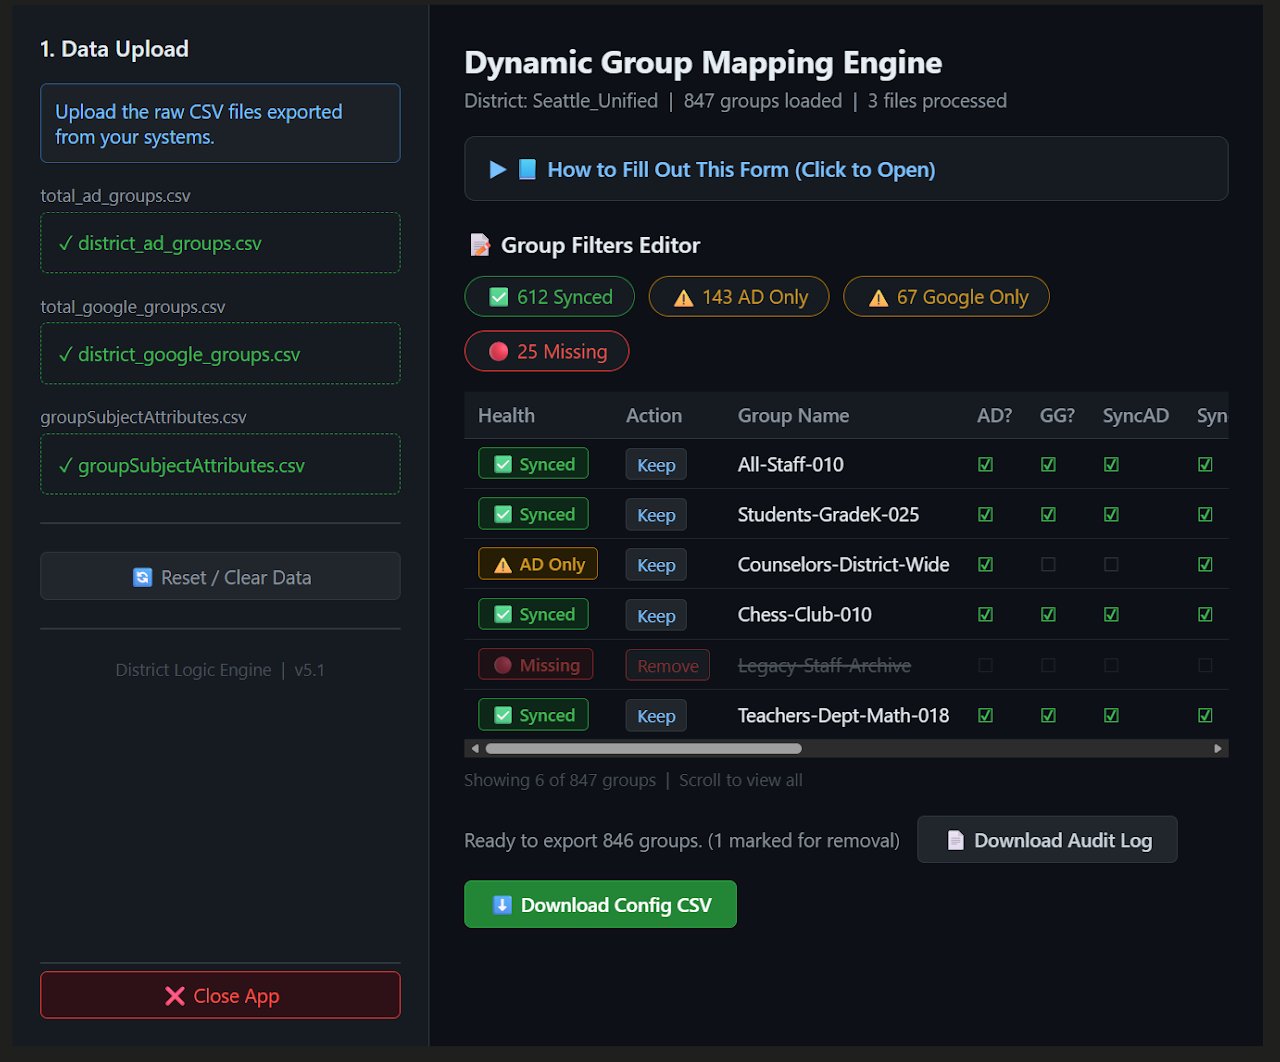
Dynamic Group Mapping Engine
Streamlit web app (v5.1) enabling non-technical admins to configure, audit, and export identity platform group rules across Active Directory and Google Workspace — eliminating manual reconciliation entirely.
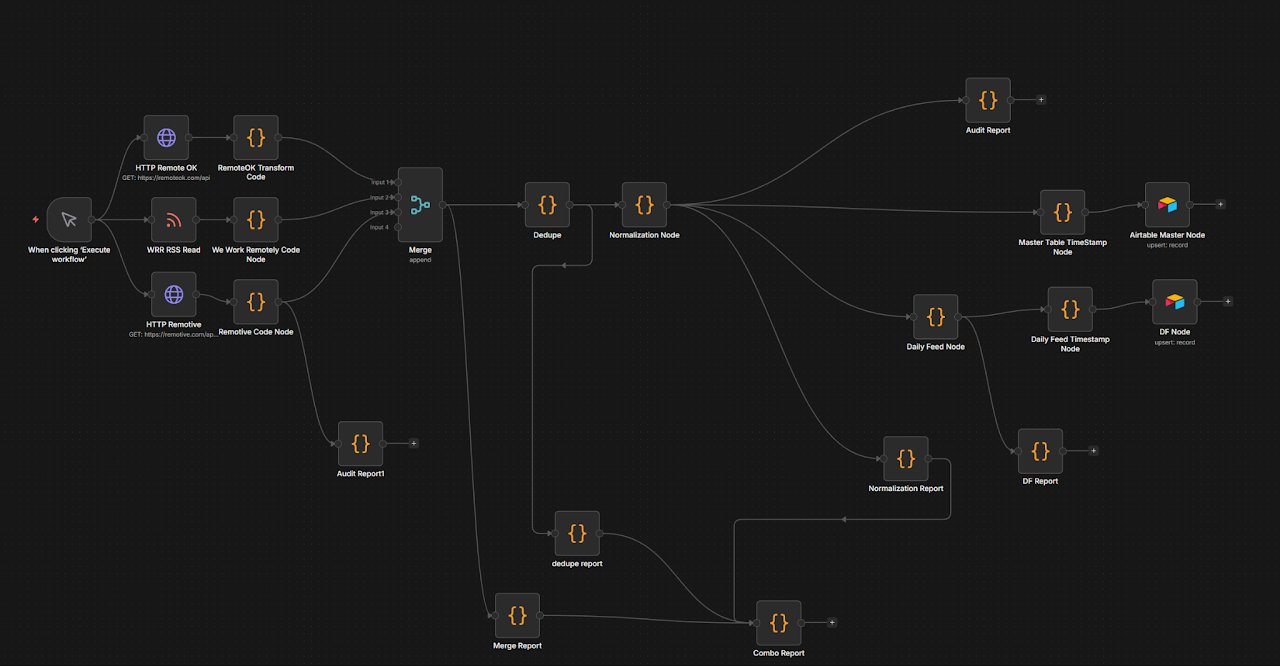
N8N/Airtable Job Aggregation Pipeline
Automated pipeline pulling from three live job APIs, merging and deduplicating records, normalizing structure, and upserting into Airtable — with full audit, normalization, and dedupe reporting.
Operational Forecasting Model
Multi-shift Excel forecasting model projecting staffing and workload demand from historical trends — one of three financial frameworks built for a 300+ employee operation's executive decision-making.
Operational Reporting & Analytics Framework
Scalable reporting system consolidating multi-source operational, staffing, and performance data — tracking 50+ metrics per shift with auto-calculated KPIs across all active campaigns.
Transaction Performance Dashboard
Financial operations dashboard with KPI frameworks for authorization rates, failure rates, and processing performance — with trend analysis visualizations designed at production reporting standards.
Financial Operations & Profitability Toolkit
Pre-field cost estimation and post-field profitability analysis — a CPI calculator combined with a multi-study financial ledger tracking true operational cost against client billing across concurrent engagements.
Salesforce Reporting & CRM Projects
Salesforce reporting solutions monitoring support operations, tracking performance metrics, and analyzing customer trends — designed for cross-functional stakeholders with focus on data integrity and usability.
Salesforce Admin Sprint — Clicked Team Project
54-slide collaborative Salesforce Admin Sprint covering the full admin curriculum: Config & Setup, Object Manager, Lightning App Builder, Sales & Service Cloud, Data Analytics, and Workflow Automation. Co-authored with a team of 8.
Power BI Operations Dashboard
Two-page interactive Power BI dashboard built on simulated call center operations data modeled after nearly 30 years of real production work — 180 studies, 664 shifts, full star schema. Cross-filtering, slicer controls, and shift-level supervisor performance analysis across AM/PM breakdowns.
Donor Data Pipeline — Multi-Source Integration Simulator
Interactive browser-based tool that simulates the multi-source donor data normalization workflow used before a Salesforce Data Loader import — field mapping, format standardization, duplicate resolution with best-value merge logic, and validated output with a full audit log.
FP&A Variance Analysis Agent — Meridian SaaS Co.
Working implementation of a fictional AI agent built as a supplement to a Senior BSA skills assessment. n8n orchestrates the pipeline; Claude generates CFO-ready variance commentary on flagged GL accounts. Mock data, real workflow.
Have a role in mind?
If one of these projects maps to a problem you're hiring to solve, let's talk.
Identity Implementation Toolchain
Three tools. One workflow. Full implementation lifecycle coverage.
The Problem
Implementing an identity platform across a K-12 district involves three distinct phases. First, the district's data across Active Directory, Infinite Campus, and Munis needs auditing for errors that block provisioning. Second, those errors need tracking through remediation across weeks of back-and-forth with district IT — often across multiple districts simultaneously. Third, the configuration must be validated before go-live. Without dedicated tools, all three phases rely on manual spreadsheet work and email threads.
The Solution
Three connected tools, each handling a distinct phase and feeding the next.
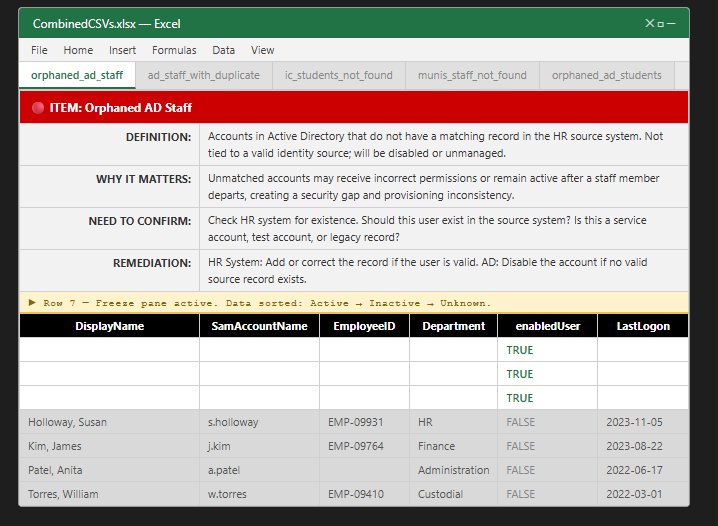
Identity Reconciliation Audit Generator
Ingests CSV exports from Active Directory, Infinite Campus, and Munis. Auto-detects status field format, sorts by active/inactive/unknown, and produces a formatted Excel workbook. Each sheet gets a color-coded remediation dashboard mapped from six error types: orphaned AD staff, orphaned AD students, duplicate staff/student IDs, IC students not found in AD, and Munis staff not found in AD. Output feeds directly into Tool 2.
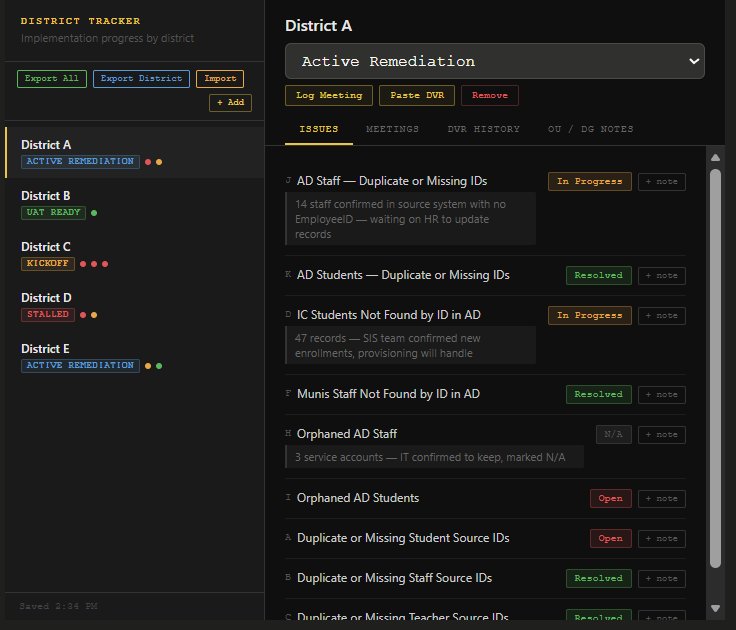
District Implementation Tracker
Browser-based dashboard for tracking multiple districts simultaneously. Each record includes phase status (Kickoff → Active Remediation → UAT Ready → Stalled), a nine-item issue checklist with per-issue notes, meeting log, OU and group mapping notes, and a DVR run history. The DVR tab parses the Audit Generator output automatically, stores counts, and shows week-over-week delta comparisons (▲ +12, ▼ -31) so you can see at a glance whether remediation is working. Full JSON export/import for portability.
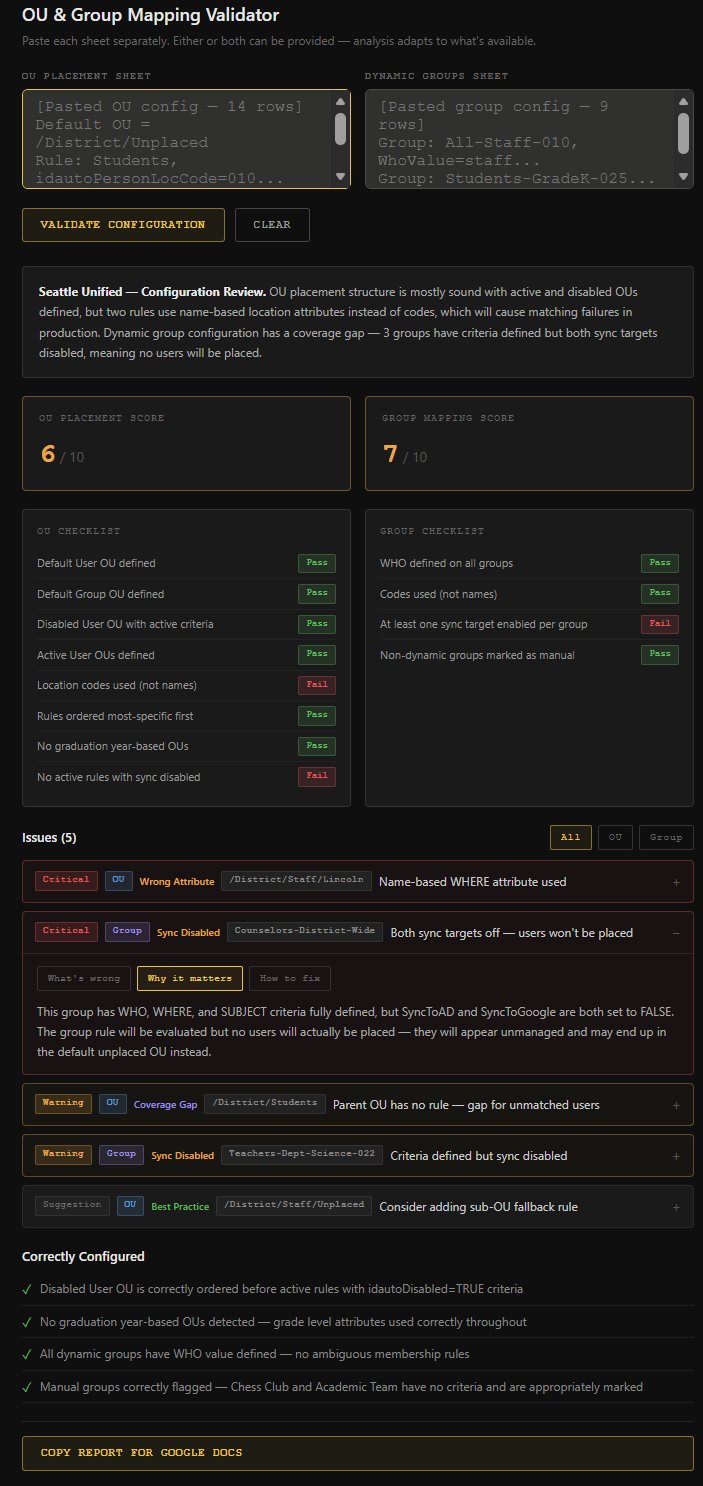
OU & Group Mapping Validator
Claude-powered configuration review tool for validating the district's OU Placement and Dynamic Group Mapping sheets before go-live. Paste the configuration, click validate, and get a scored report with prioritized issues, expandable What/Why/Fix detail, pass/fail checklists, and a one-click copy for client documentation — all in seconds. Designed to be used live on client calls.
What It Demonstrates
- End-to-end systems thinking — three tools designed as a connected workflow
- Full-stack breadth: Python data processing, vanilla JS browser app with localStorage persistence, Claude API-powered validation tool
- Deep K-12 identity domain expertise: provisioning workflows, source system reconciliation, OU configuration, dynamic group management
- Designing for real users under real constraints — used live on client calls, built to handle messy real-world data
Screenshots
Operational Data Transformer
Desktop GUI for configurable conditional transformation of structured operational files.
Overview
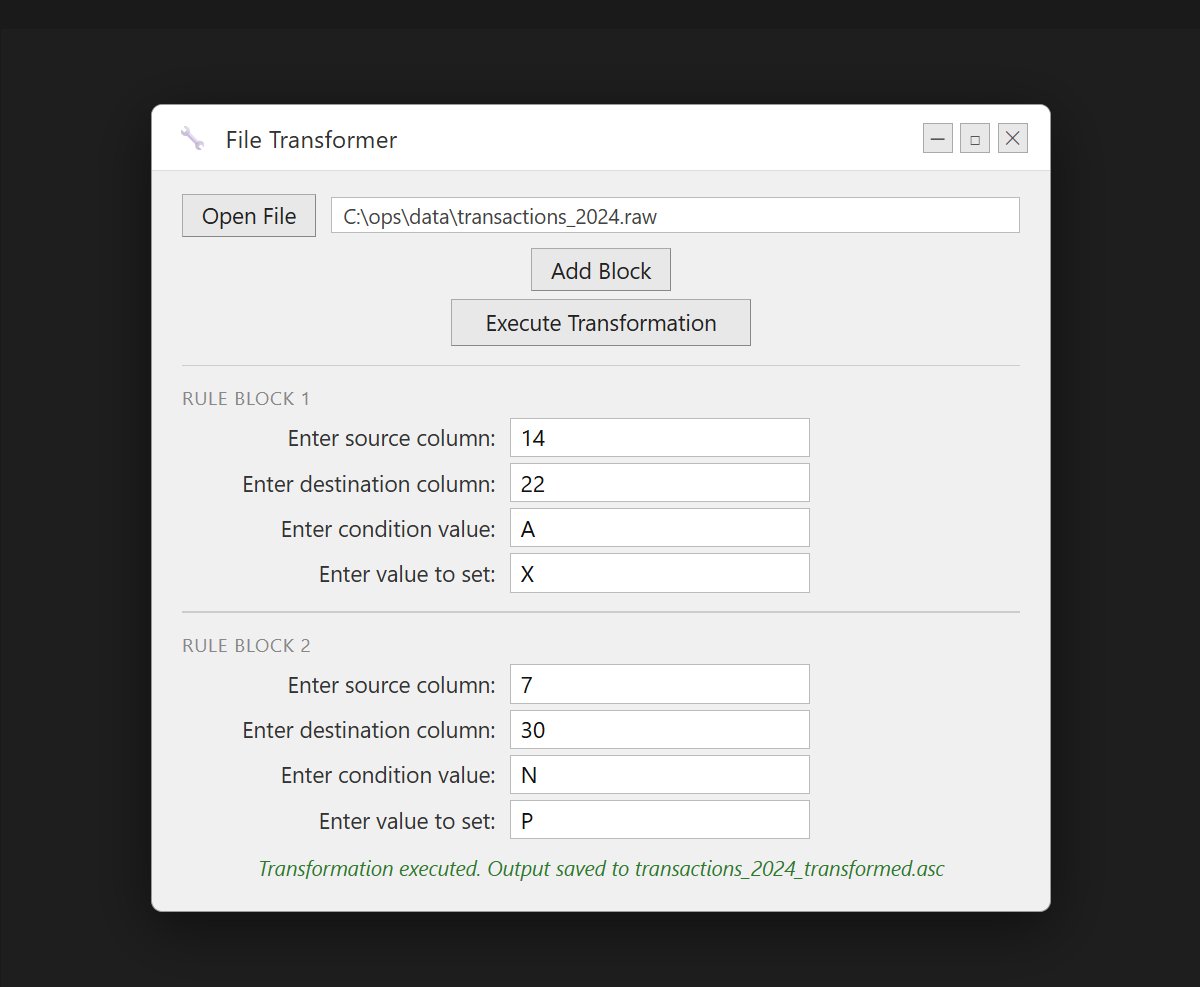
A Python-based desktop utility that transforms structured data files based on configurable rule sets. Users define conditional transformation rules and apply them to operational datasets through a graphical interface — no command line required.
Use Case
Transforming structured operational files where specific column values must be updated based on defined conditions before ingestion into another system. Built to eliminate repetitive manual file modification and reduce pre-ingestion data preparation errors that accumulated across the operational cycle at GMRS.
What It Demonstrates
- Translating a repetitive manual workflow into a reusable, configurable tool
- Python GUI development with Tkinter for non-technical end users
- Data transformation logic using Pandas applied to real operational file structures
Screenshot
Multi-Source Dataset Combiner
GUI tool for merging disparate datasets into a unified structure for reporting and analysis.
Overview
Built to merge datasets from multiple sources into a unified structure suitable for reporting and analysis — eliminating manual consolidation work that was error-prone and time-consuming across GMRS's multi-project environment.
The Problem It Solved
Operational data at GMRS originated from multiple separate systems and file formats. Combining them for reporting required manual work that introduced inconsistencies and consumed significant staff time every cycle. This tool codified the merge logic and made it repeatable and auditable.
What It Demonstrates
- Multi-source data pipeline design — normalizing and merging sources correctly, not just reading files
- Turning a manual, error-prone process into a reliable, repeatable tool
- Python/Pandas data engineering applied to real operational workflows
Screenshot
Disposition Merge Automation Tool
Merges and standardizes disposition data from multiple sources into a unified reporting dataset.
Overview
Merges and standardizes disposition-level data from multiple sources into a unified reporting dataset. Replaced manual consolidation processes, reducing errors and significantly improving data consistency for operational reporting and analysis across GMRS research campaign lifecycles.
What It Demonstrates
- Applied automation to a high-frequency, error-prone operational task
- Data standardization logic across inconsistent source formats
- Python/openpyxl for structured Excel output generation
Screenshot
Dynamic Group Mapping Engine
Streamlit v5.1 — non-technical admin interface for group rule configuration, audit, and export.
Overview
A Streamlit web application enabling non-technical administrators to configure, audit, and export identity platform dynamic group mapping rules across Active Directory and Google Workspace — without touching raw configuration files or requiring technical knowledge of the underlying systems.
What It Replaced
Manual reconciliation of group mapping rules that required technical staff to directly inspect and compare configurations across systems. The engine made this accessible to implementation managers and reduced reconciliation from hours to minutes.
What It Demonstrates
- Streamlit application design for non-technical end users in a production environment
- Deep knowledge of identity platform group rule architecture
- Building tools that increase operational capacity without adding technical headcount
Screenshot
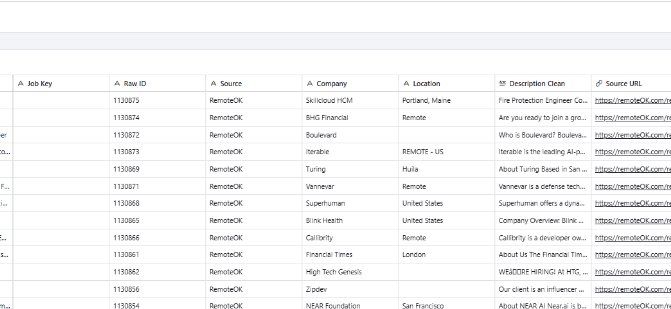
N8N/Airtable Job Aggregation Pipeline
Fully automated multi-source job data pipeline — built to solve a real problem during an active job search.
The Problem
Remote job listings are scattered across dozens of platforms with inconsistent formatting, duplicate postings, and no unified view. Manually tracking and comparing listings across sources is time-consuming and error-prone — exactly the kind of problem that should be automated.
What It Does
- Pulls live data from RemoteOK API, We Work Remotely RSS, and Remotive API simultaneously
- Merges all records into a unified stream and deduplicates across sources
- Normalizes data structure and field values across sources with inconsistent schemas
- Routes records into Master Table and Daily Feed views in Airtable via upsert
- Generates audit, normalization, dedupe, and combo reports for pipeline visibility
What It Demonstrates
- Practical workflow automation using n8n node-based architecture
- Multi-source data ingestion, transformation, and normalization across inconsistent APIs
- Real-world application — built to solve an actual operational problem, not as a demonstration
Screenshots
Operational Forecasting Model
Multi-shift staffing and workload forecasting — built for a 300+ employee operation.
Overview
An Excel-based forecasting model projecting staffing requirements and workload demand across multiple shifts based on historical trends. Built for a 300+ employee, multi-project call center operation where accurate staffing projection directly affected production capacity and client deliverable timelines.
Part of a Broader Financial Framework
One component of a three-part financial operations suite — alongside the CPI Calculator and Multi-Study Profitability Tracker — that together served as the central financial intelligence layer for GMRS executive decision-making.
What It Demonstrates
- Applied Excel modeling for operational forecasting in a complex, dynamic environment
- Understanding of how staffing projections connect to production outcomes and financial results
- Building systems that translate raw operational data into decision-ready outputs
Screenshot
Operational Reporting & Analytics Framework
50+ metrics per shift, auto-calculated KPIs, single source of truth across a 30-year operation.
Overview
A scalable reporting and analytics framework consolidating multi-source operational, staffing, and performance data into a single source of truth. Designed to track 50+ metrics per shift across campaign lifecycles with auto-calculated KPIs and a structured data entry architecture — replacing informal, inconsistent reporting practices across all active research campaigns at GMRS.
What It Replaced
Informal, ad-hoc shift reporting that varied by supervisor and couldn't be reliably aggregated or audited. The framework standardized what was captured, how it was captured, and how it connected to downstream financial and billing systems.
What It Demonstrates
- Systems thinking at the operational level — connecting shift-level data to executive-level visibility
- Excel architecture for structured data entry that maintains integrity at scale
- Reporting design that serves multiple stakeholders: floor supervisors, operations management, and executive leadership
Screenshot
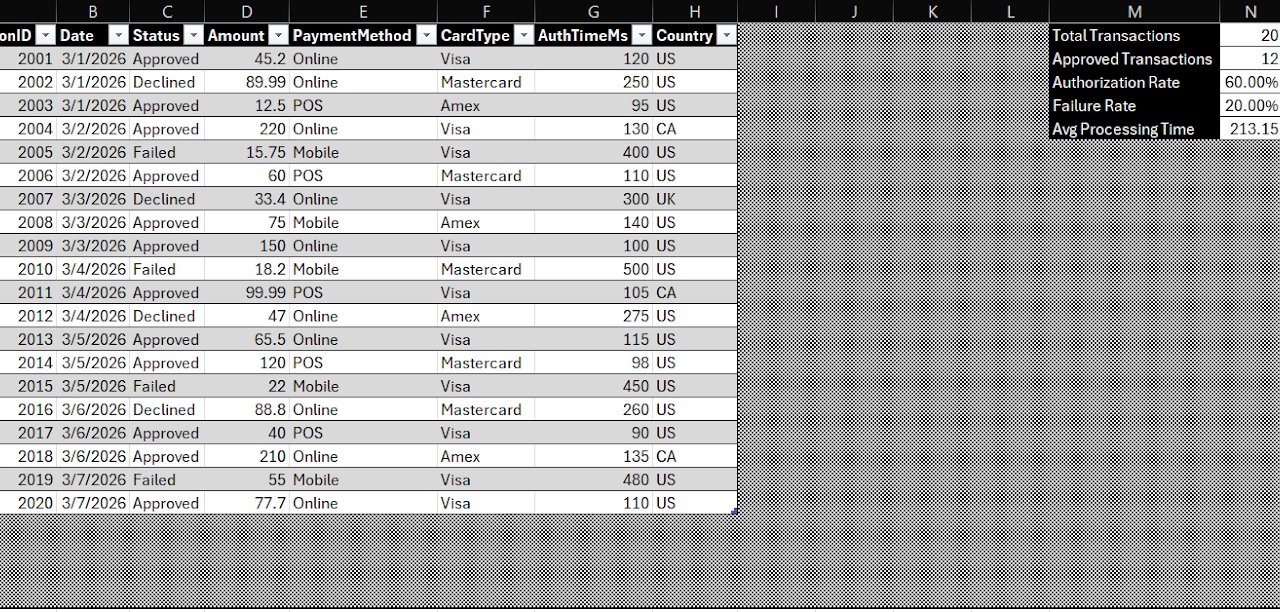
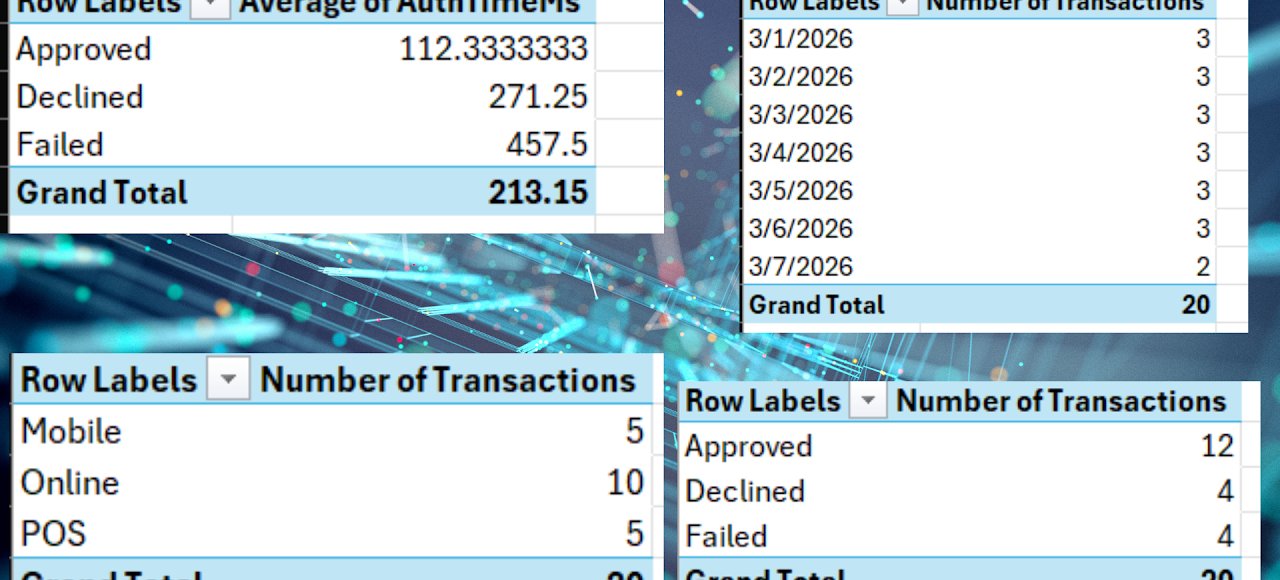
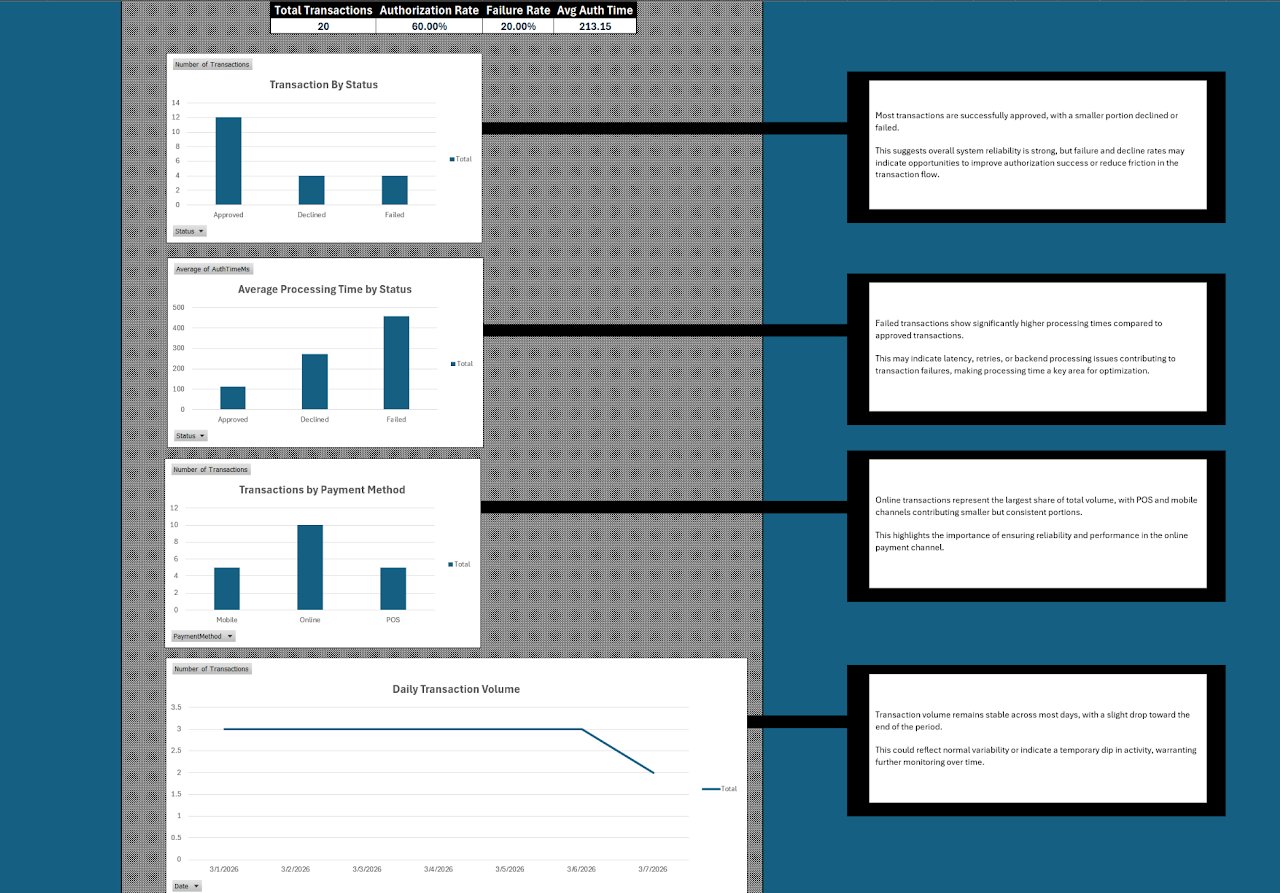
Transaction Performance Dashboard & Reporting Model
Financial operations dashboard demonstrating production-level KPI reporting and trend analysis.
Overview
A financial operations dashboard built using simulated transaction data to replicate real-world reporting scenarios. Developed KPI frameworks for authorization rates, failure rates, and processing performance, with visualizations for trend analysis and operational monitoring.
Design Intent
Built to demonstrate clean data structure, reporting accuracy, and actionable insights at a production level — not a toy example, but a genuine template for the kind of financial reporting used to monitor transaction processing operations. Emphasized structural clarity and reproducibility.
What It Demonstrates
- Financial KPI framework design: authorization rates, failure rates, processing performance
- Dashboard layout and visualization design for operational decision-making
- Clean data architecture that supports reliable, reproducible reporting
Screenshots
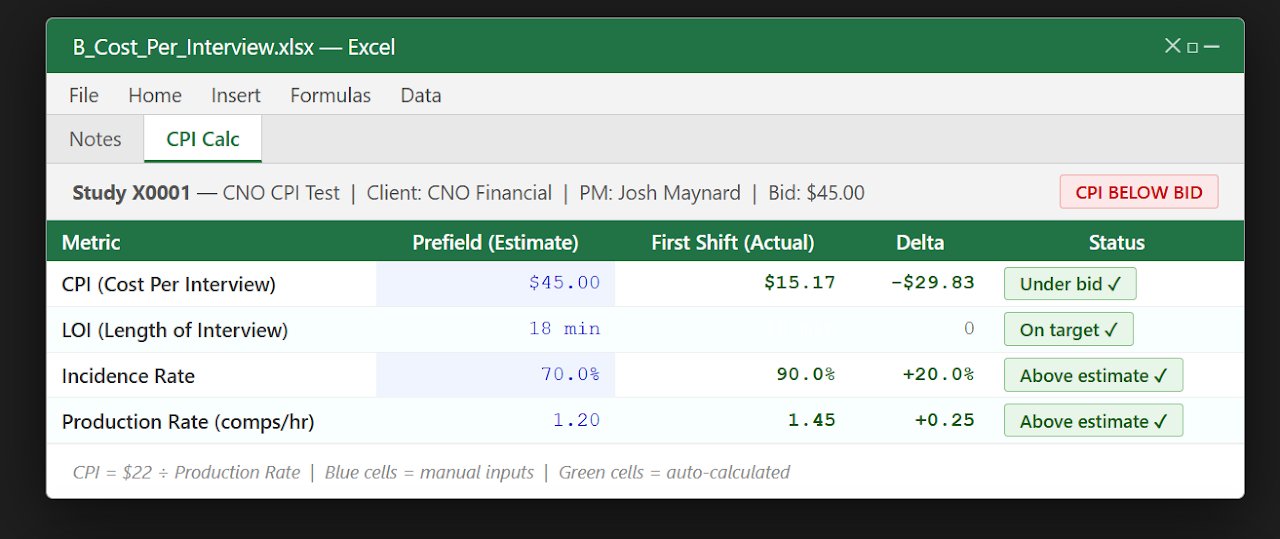
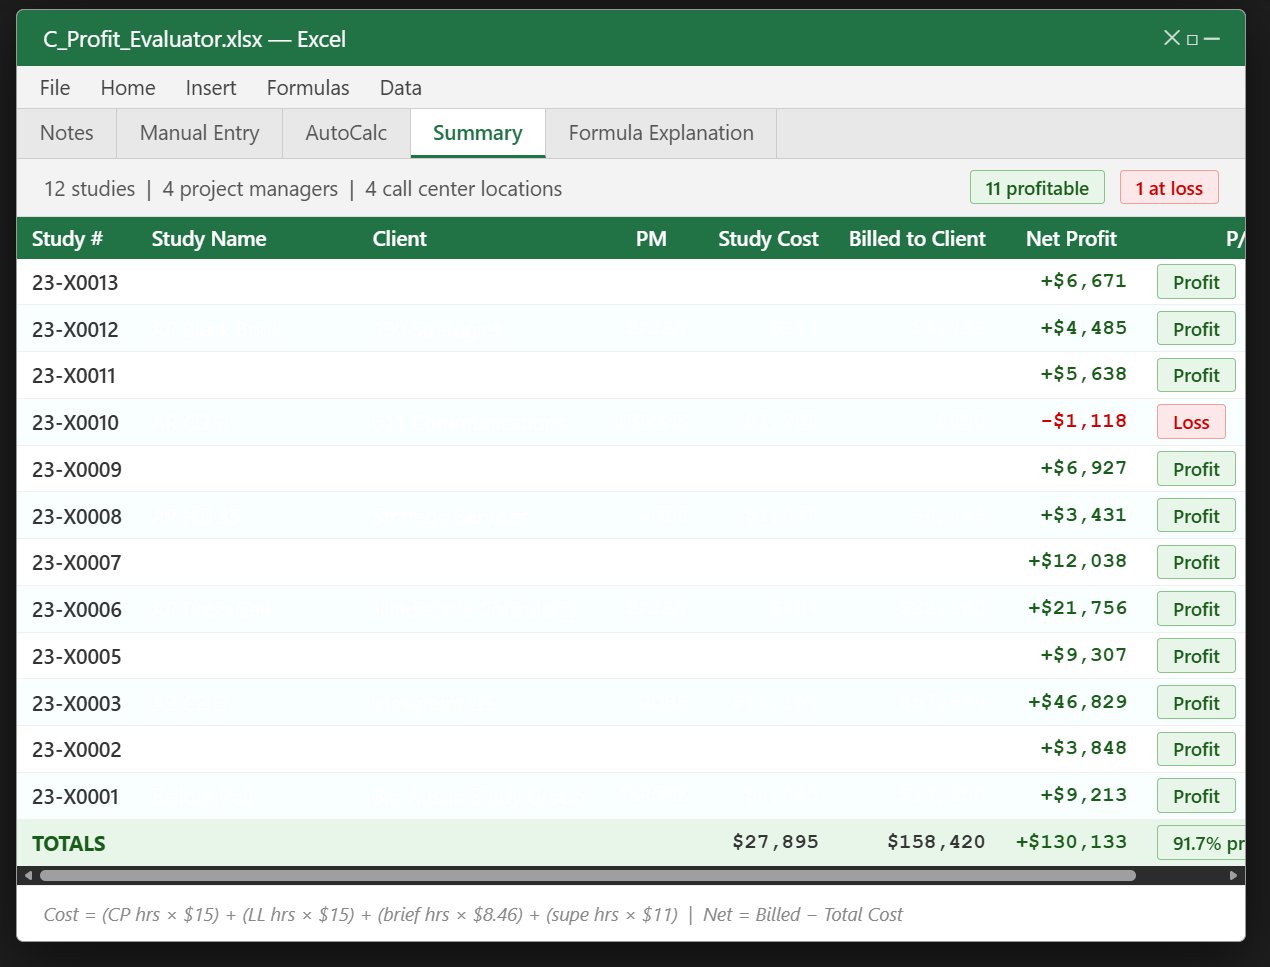
Financial Operations & Profitability Toolkit
Pre-field cost estimation + post-field profitability analysis across concurrent research studies.
Overview
A two-component financial toolkit for research study management: a pre-field cost estimator projecting the cost-per-interview before a study begins, and a post-field profitability tracker comparing true operational cost against client billing across all concurrent studies.
Why It Mattered
In a multi-client call center running dozens of concurrent research studies, billing accuracy and profitability visibility were critical. Without systematic tracking, individual study margins were invisible until invoicing — by which point it was too late to course-correct. This toolkit brought real-time financial visibility to every active study.
What It Demonstrates
- Financial modeling applied to operational research environments
- Pre-field / post-field analytical framework design
- Multi-study ledger architecture that scales across concurrent client engagements
- Understanding of how operational decisions connect directly to financial outcomes
Screenshots
Salesforce Reporting & CRM Projects
Certified Salesforce Associate — reporting solutions for support operations and customer analytics.
Overview
Salesforce reporting solutions designed and maintained to monitor support operations, track key performance metrics, and analyze customer trends at Identity Automation — built for cross-functional stakeholders with focus on data integrity, report accuracy, and usability.
Key Applications
- Built reporting to track adoption trends across the K-12 customer portfolio
- Monitored support activity and operational risk indicators by customer and district
- Designed dashboards supporting cross-functional visibility for CSE, TAM, and leadership teams
- Maintained data integrity across CRM records tied to active implementations
Full Project — PDF
A Clicked project demonstrating end-to-end Salesforce dashboard design: requirements gathering from a stakeholder interview, custom object + field creation, mock data import via the Data Import Wizard, report building, and final dashboard delivery on desktop and mobile.
Salesforce Admin Sprint — Team 15
54-slide collaborative project covering the full Salesforce Admin curriculum — co-authored with a team of 8.
Overview
A 54-slide collaborative Salesforce Admin Sprint project completed through Clicked, covering the full Salesforce Admin curriculum across seven task sets: Configuration & Setup, Object Manager & Lightning App Builder, Sales & Service Cloud, Data Analytics Management & Productivity, and Workflow & Process Automation.
What It Shows
- End-to-end Salesforce admin competency across the full curriculum
- Ability to structure and present technical work clearly for a professional audience
- Collaborative project execution across a team of 8 contributors
- Canva-produced presentation demonstrating visual communication alongside technical content
Full Project — PDF
A 54-slide collaborative Salesforce Admin Sprint project completed through Clicked, covering the full Salesforce Admin curriculum across seven task sets: Configuration & Setup, Object Manager & Lightning App Builder, Sales & Service Cloud, Data Analytics Management & Productivity, and Workflow & Process Automation.
Power BI Operations Dashboard
Two-page interactive dashboard built on a star schema modeled after real call center operations — 180 studies, 664 shifts, full cross-filtering.
Dashboard Preview
Animated walkthrough showing slicer filtering, cross-filter interaction, and page 2 shift-level analysis. Built in Power BI Desktop on mock data modeled from real operational structure.
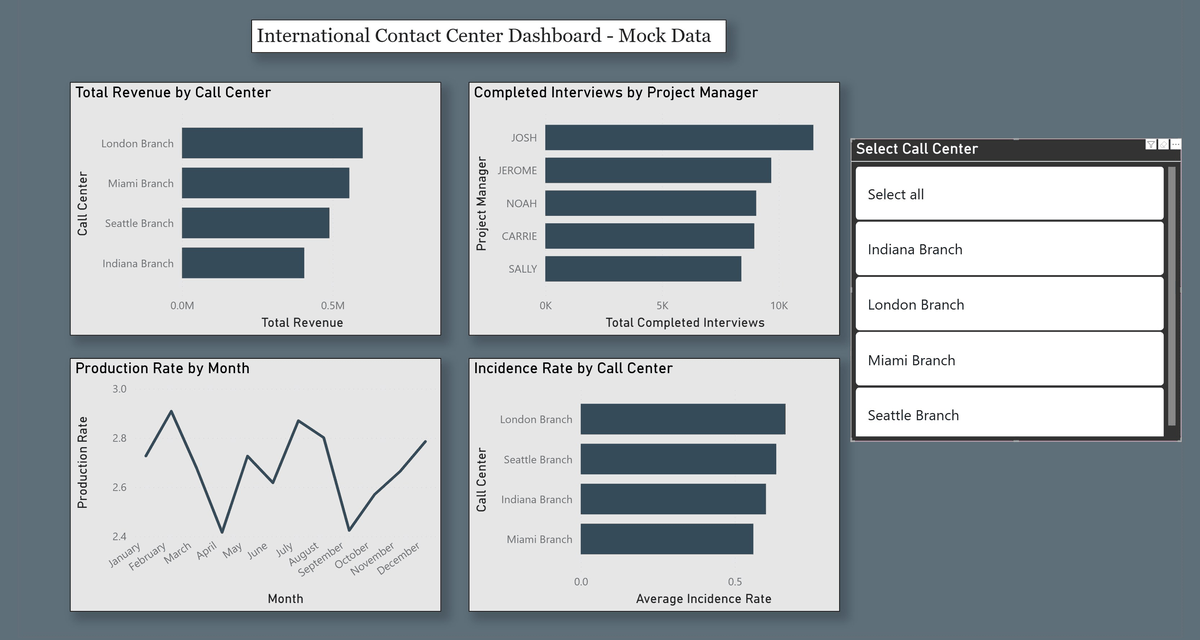
The Context
Nearly 30 years of call center operations data no longer exists in accessible form — but the metrics, structures, and operational logic do. This project reconstructs a representative dataset from that institutional knowledge: 180 concurrent research studies across four branch locations, 664 individual shifts tracked across AM/PM breakdowns, and a full date dimension — all modeled as a proper star schema with defined relationships.
The goal was twofold: build real Power BI hands-on experience with data that actually means something, and produce a portfolio artifact that demonstrates operational analytics thinking — not just chart-clicking on a sample dataset.
The Data Model
Three tables connected via defined relationships in Power BI's model view:
- studies — 180 rows, one per research project. Study name, client, call center, PM, LOI, incidence rate, LL/CP completes and hours, production rate, CPI vs. bid CPI, and full charge breakdown through total revenue.
- shifts — 664 rows, one per shift worked across 60 studies. AM/PM breakdowns, supervisor, dial metrics, production rate, comprate, TQs by termination reason, refusals, breakoffs, and answering machines.
- dim_date — Full date dimension covering 2023–2024 with year, quarter, month, week, and weekday flag for time intelligence.
Page 1 — Study Overview
Four visuals with a call center slicer providing interactive cross-filtering across all charts simultaneously:
- Total Revenue by Call Center (horizontal bar)
- Completed Interviews by Project Manager (horizontal bar)
- Average Production Rate by Month (line chart — monthly trend)
- Average Incidence Rate by Call Center (horizontal bar)
Page 2 — Shift-Level Operations
Drill-down into shift performance with cross-filtering active across all three visuals:
- Production Rate by Supervisor (average, horizontal bar)
- Production Rate by Supervisor and Shift — AM vs. PM breakdown (clustered bar with legend)
- Breakoffs and Refusals by Month (dual-axis line chart — separate Y-axes for each metric)
What It Demonstrates
- Star schema data modeling with defined table relationships
- Correct aggregation choices (Average vs. Sum) for rate-based metrics
- Cross-filtering behavior across related tables
- Slicer design with user experience considerations (Select All, filter reset)
- Dual-axis charting for metrics at different scales
- Multi-page dashboard architecture with consistent visual language
Donor Data Pipeline — Multi-Source Integration Simulator
Interactive browser-based tool simulating the full multi-source donor data normalization workflow used before a Salesforce Data Loader import — field mapping, deduplication, format standardization, and audited output.
The Problem This Models
Before any donor data can be loaded into a CRM — Salesforce, Microsoft Dynamics, Blackbaud, or otherwise — it has to be cleaned. Every nonprofit technology implementation runs this gauntlet: data arrives from three or four sources, each with different field names, different formatting conventions, and duplicate records for the same person. Someone has to normalize it, resolve the duplicates, document every decision, and produce a validated output file the import tool will actually accept.
This simulator models that workflow end to end across three realistic source systems: a Salesforce Contacts export (with real NPSP field names like npo02__TotalOppAmount__c), an email platform subscriber export, and an event sign-in spreadsheet.
What the Pipeline Actually Does
The tool isn't decorative — the JavaScript is executing each step against real authored source data:
- Stage 1 — Ingest: Reads 33 total records across three sources with inconsistent schemas and field naming conventions
- Stage 2 — Field mapping: Resolves 12 source field variants (
FirstName / fname / First Name) to a single canonical donor schema - Stage 3 — Quality validation: Catches and corrects phone number formats, state name abbreviations, invalid values, and missing critical fields — with counts and specific examples for each issue type
- Stage 4 — Deduplication: Detects cross-source duplicate groups via email matching, applies best-value field selection logic on merge (CRM giving history preferred over email platform engagement data), and resolves name variants like "Pat Harris" vs. "Patricia Harris"
- Stage 5 — Output: Produces a real downloadable CSV (39 unique records, Salesforce NPSP Contact schema compatible) and a timestamped audit log of every transformation
Design Decisions Worth Explaining
CRM export, email platform, and event sign-in sheet are the three most common sources a nonprofit data team encounters at the start of a new client engagement. Each represents a different level of data discipline. The NPSP field names in the CRM export reflect real Salesforce vocabulary — not invented names. Handling all three is the actual job.
In production data work, every transformation has to be documented — when a client asks why a record changed, there has to be a traceable answer. The audit log captures what changed, why, and which source record was treated as master. That accountability layer distinguishes someone who owns a data workflow from someone who ran a script.
This is a working model of how I think about data operations problems, built in JavaScript so it runs in a browser without infrastructure. A production pipeline would use Python, Pandas, a proper dedup library, and a validated import process with error row review. What this demonstrates is the underlying methodology: define the canonical schema first, map sources to it explicitly, treat every quality issue as a documented decision, and produce output your downstream system can trust. That approach doesn't change whether the tool is written in FoxPro, Python, or JavaScript.
What It Demonstrates
- Systems thinking across the full data operations loop — ingest → map → validate → deduplicate → output → document, not just individual tasks
- Nonprofit CRM domain fluency — real NPSP field names, Salesforce Data Loader output schema, the specific quality problems that appear in nonprofit donor data
- Audit-first methodology — every transformation is a documented decision, not a silent correction
- Best-value merge logic — source record preference is deliberate and explained, not arbitrary
- Building tools to demonstrate thinking, not just describe it
NPSP Donor Data Operations Simulator
Interactive browser-based walkthrough of the four data operations at the core of Salesforce Nonprofit Success Pack work — the Household Account model, hard and soft gift credits, constituent deduplication, and communication-preference-aware tax receipt batches.
Why This Exists
The Donor Data Pipeline Simulator (its sibling project) covers what happens before data enters a nonprofit CRM. This tool covers what happens inside it — the NPSP-specific data model decisions that determine whether reporting, receipting, and donor relationships actually work. Built to demonstrate working knowledge of the data model itself, not just the vocabulary.
The Four Modules
- Household Account model: Ungrouped contacts resolve into Household Accounts with combined giving roll-ups — including the edge case household grouping rules have to get right (same last name, different address resolves to a separate household)
- Hard vs. soft credits: Gift entry with automatic household soft credits for spouses and an employer matching-gift path — with separated totals showing why finance reports on hard credits only while development reporting may include soft-credit recognition
- Constituent deduplication: A 12-record file scanned with nickname normalization (Bob ↔ Robert, Liz ↔ Elizabeth, Peggy ↔ Margaret), email/address/phone match scoring with stated reasons, and a merge preview where the surviving record keeps the most complete value per field
- Tax receipt batch run: A weekly batch that honors Do Not Mail / Do Not Email flags, routes by preferred channel, holds records that fail address validation, suppresses anonymous gifts — and logs every exclusion with its reason
Design Decisions Worth Explaining
High-volume receipt production is where data quality becomes legally and reputationally visible. The interesting engineering isn't generating the receipts that go out — it's the auditable record of who was skipped and exactly why. Honoring a donor's communication preferences is a data operations responsibility, and every exclusion in this simulation is a documented decision, not a silent drop.
This is a browser-based simulation of NPSP data behavior — it is not connected to a Salesforce org. The logic mirrors what I built and ran in production for nearly three decades: multi-source integration, deduplication via unique indexing, validation frameworks, and exception handling for malformed records — translated into the NPSP vocabulary and object model.
What It Demonstrates
- NPSP data model fluency — Household Accounts vs. one-to-one and Person Account models, Opportunity-based gift entry, automatic household soft credits
- The revenue-integrity distinction — why conflating hard and soft credits is one of the most common nonprofit reporting errors, and how the model prevents it
- Dedup methodology — normalized comparison, weighted multi-signal scoring with stated reasons, best-value survivorship on merge
- Preference-aware communications — donor consent flags treated as hard constraints with an auditable exclusion trail
SOQL Query Workbench — NPSP Edition
Six production-pattern queries in real SOQL syntax against NPSP objects — selectable from a library, executed live against an in-browser sample dataset, each with an explanation of why a fundraising operation runs it.
Why This Exists
Decades of hand-written SQL is one claim; being able to query Salesforce specifically is another. This workbench is the bridge: the same relational thinking — aggregation, grouping, filtering, anti-joins — expressed in the SOQL dialect against the NPSP object model, applied to the questions fundraising teams actually ask.
The Query Library
- Top households by lifetime giving — the foundational NPSP roll-up: closed-won Opportunities grouped by Household Account
- LYBUNT report — donors who gave Last Year But Unfortunately Not This: the most actionable retention list in fundraising, built on NPSP's Contact rollup fields
- SYBUNT report — gave Some Year But Unfortunately Not This, ordered by lapse age for reactivation segmentation
- Soft credit recognition — non-primary OpportunityContactRole totals per contact: household recognition without double-counting revenue
- Lapsed major donors — $1,000+ lifetime giving with no gift in 2+ years, using SOQL's LAST_N_YEARS relative date literal
- Year-over-year giving trend — the board-meeting query, using SOQL's CALENDAR_YEAR() date function
Design Decisions Worth Explaining
The SOQL shown is real — real NPSP field names (npo02__TotalOppAmount__c, npo02__OppAmountLastYear__c), real Salesforce date literals and functions. The execution layer is JavaScript running the equivalent logic over authored sample data, clearly labeled as such. The point is demonstrating that the query logic, the object model, and the fundraising vocabulary are understood — in a form anyone can verify in a browser without org access.
These reports are fundraising-native vocabulary — the retention lists every development office runs at fiscal year boundaries. Including them signals domain fluency, not just SQL fluency: knowing which questions matter is the analyst's half of the job.
What It Demonstrates
- SQL-to-SOQL transfer — aggregation, grouping, and filtering logic carried from decades of production SQL into the Salesforce dialect
- NPSP object model fluency — Contact rollup fields, Opportunity-based gifts, OpportunityContactRole soft credits
- Fundraising domain vocabulary — LYBUNT, SYBUNT, lapse segmentation, major donor thresholds
- Analyst judgment — every query paired with the operational reason a team runs it
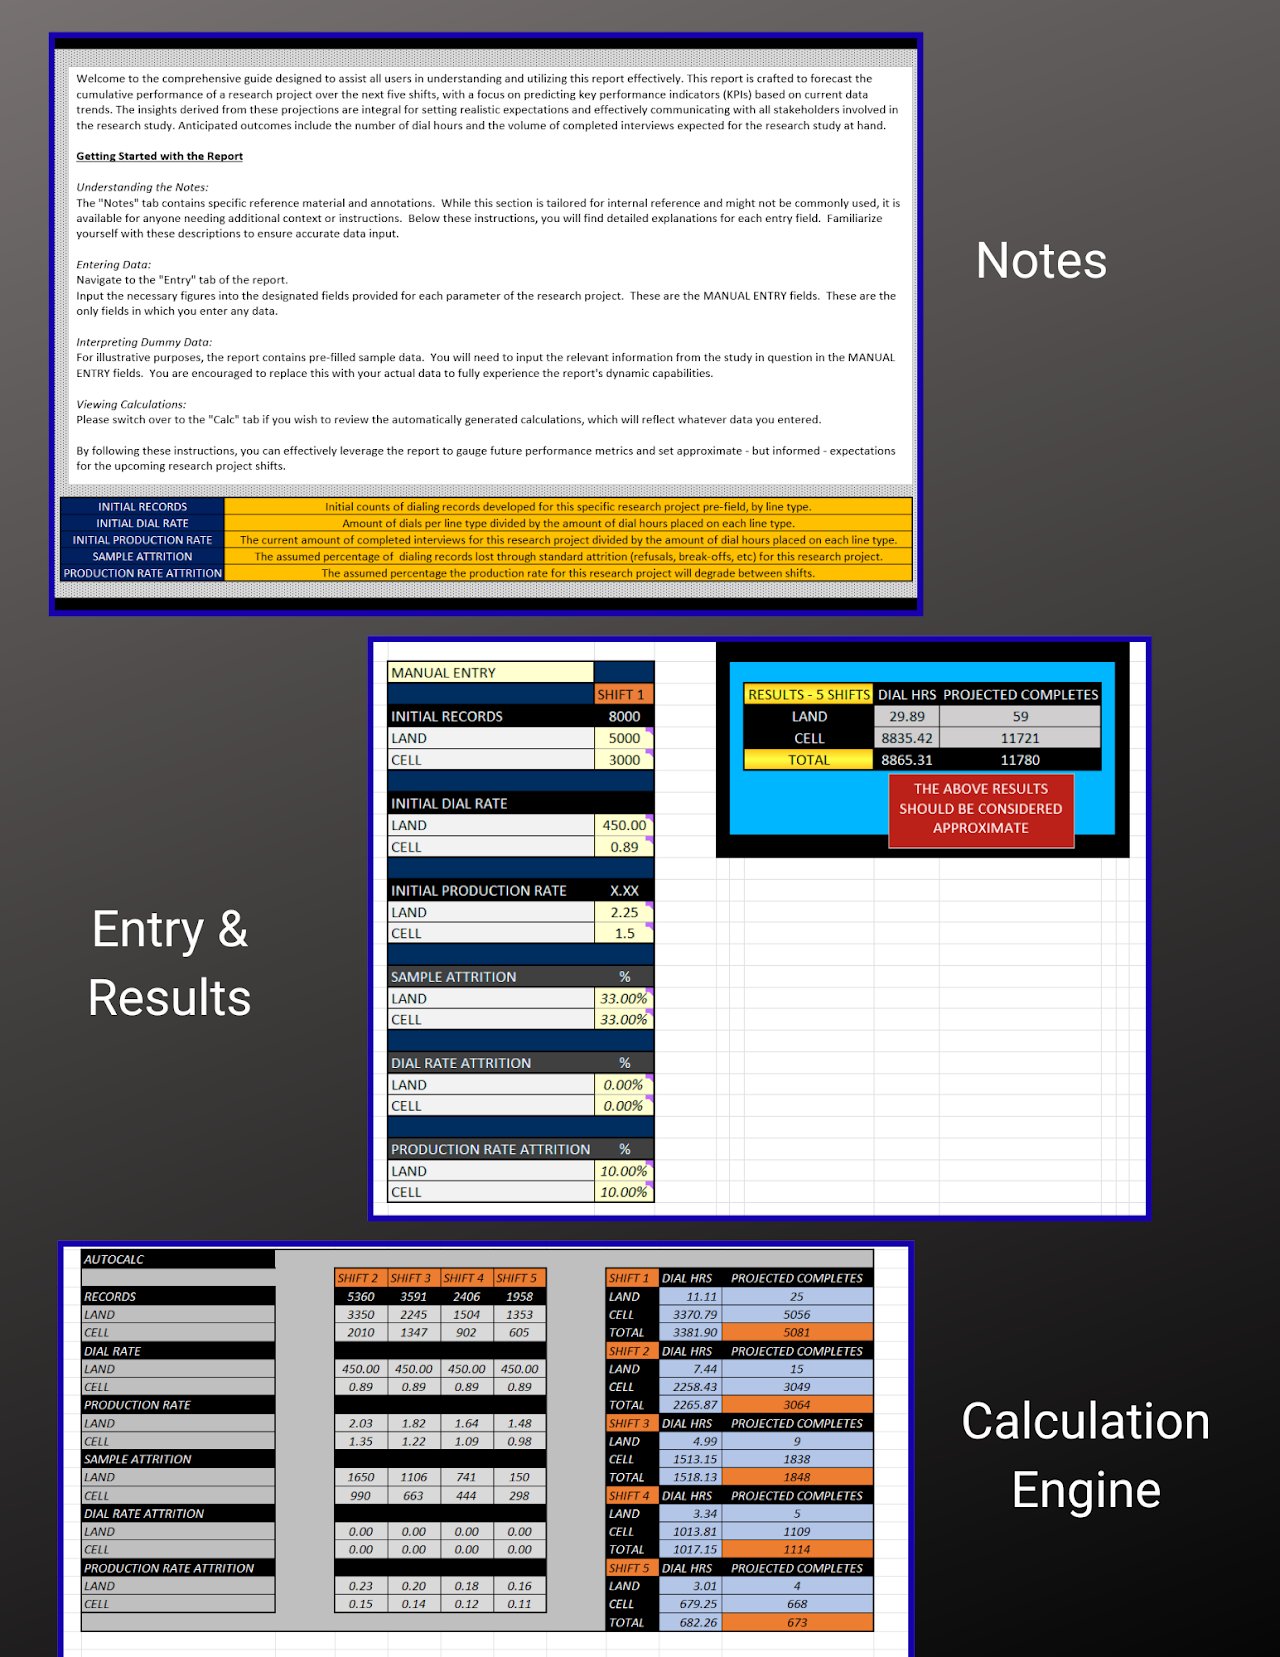
Multi-Dimensional Quota & Sampling Engine
An interactive demonstration of multi-dimensional quota management. Across thousands of production studies, clients issued the quota specifications — my work was formatting and preparing the sample so those quotas could be managed in the field. This demo models that management layer: 32 concurrent quota cells, shift-by-shift fill simulation with differential response rates, and variance analysis that converts attainment math into floor decisions.
The Problem This Models
A research study needs 600 completed interviews — but not just any 600. The dataset must mirror the target population across every dimension at once: age bracket, region, and sample type. That turns one target into 32 concurrent micro-targets, each of which must close for the data to be representative. And cells fill unevenly: younger respondents are harder to reach, cell-phone sample converts differently than landline, regional contact rates vary by shift. Passive monitoring fails; the operation needs variance analysis that surfaces under-pacing cells while there's still field time to act.
What the Simulation Does
- Quota structure: stratifies a client-issued 600-complete specification across 4 age brackets × 4 regions × 2 sample types using population weights — the spec is the client’s; making it operational is the job
- Shift simulation: each "Run shift" applies differential response propensities plus production noise, so the matrix fills realistically unevenly across a 14-shift field period
- Attainment heatmap: every cell color-codes its fill rate against pace; filled quotas close and production against them stops — every interview against a closed cell is wasted cost
- Variance report: under-pacing cells ranked worst-first, each with the per-shift completion rate now required and the floor intervention: which sample to load, where to weight interviewer hours, when to escalate
Provenance
This demonstration draws on sample preparation and quota management work I did in production FoxPro/SQL systems at Global Marketing Research Services across nearly three decades and thousands of studies — translating client-issued quota specifications into production sample structures via demographic recoding, stratification, randomization, and file partitioning. The simulation is its own build with generated data — it models the methodology so it can be explored in a browser; it is not a rebuild of the production system.
The math is segment-constrained target attainment — the same structure as RevOps pipeline coverage targets, capacity planning, demand allocation, and any operation where a total goal must be hit across intersecting segment constraints while resources get reallocated mid-flight based on variance.
What It Demonstrates
- Spec-to-structure translation — taking a client-issued quota specification and making it operational: the business-analyst bridge between research design and production
- Statistical sampling methodology — stratification, population weighting, differential response modeling
- Real-time operational analytics — pace-vs-plan tracking with automatic cell closure at quota
- Variance-driven decision-making — analysis that ends in an instruction, not just a number
- Deep operational expertise — methodology grounded in three decades of production quota and sampling work